Infographic Maker: 5 Simple Steps to Create Cool Infographics without a Designer
Do you enjoy infographics? Even if you are not a professional infographic maker and think you don’t like it, your brain does. Nowadays, it’s not a secret that the human brain processes images 60,000 times faster than text. Moreover, infographics are a convenient way to convey significant information to your audience quickly.

Creating cool infographics from scratch was a task only a good designer could successfully cope with. Fortunately, you don’t need special tech skills to create stunning infographics today. Almost anyone with a strong desire can amaze the world with his infographic creation using an infographic maker.
What Is an Infographic Maker?
If you are a beginner just starting your journey in the amazing world of infographics, an infographic maker is a vehicle that can make your journey easier. Whether you want to highlight the strengths of your favorite social media platforms for marketing or expound Darwin’s Evolution Theory, you’ll easily do it with an infographic maker.
Infographic makers are online tools that allow even a novice to create powerful infographics. Most of them are simple to use due to their drag-and-drop features and various helpful customization options. Furthermore, they offer you a set of templates as a starting point. That’s why the whole process of creating your infographic will take you less than an hour.
What Infographic Maker to Choose?
Tastes differ. So do the personal requirements for an infographic maker. Someone will prefer an infographic maker with the most significant number of templates. Some will choose the one that allows you to work with static and dynamic infographics. Others will look at the pricing. However, if you are just a beginner, it’s better to base your choice on the simplicity of usage.
Maybe the handiest infographic makers for a beginner are Easel.ly, Piktochart, and Canva.
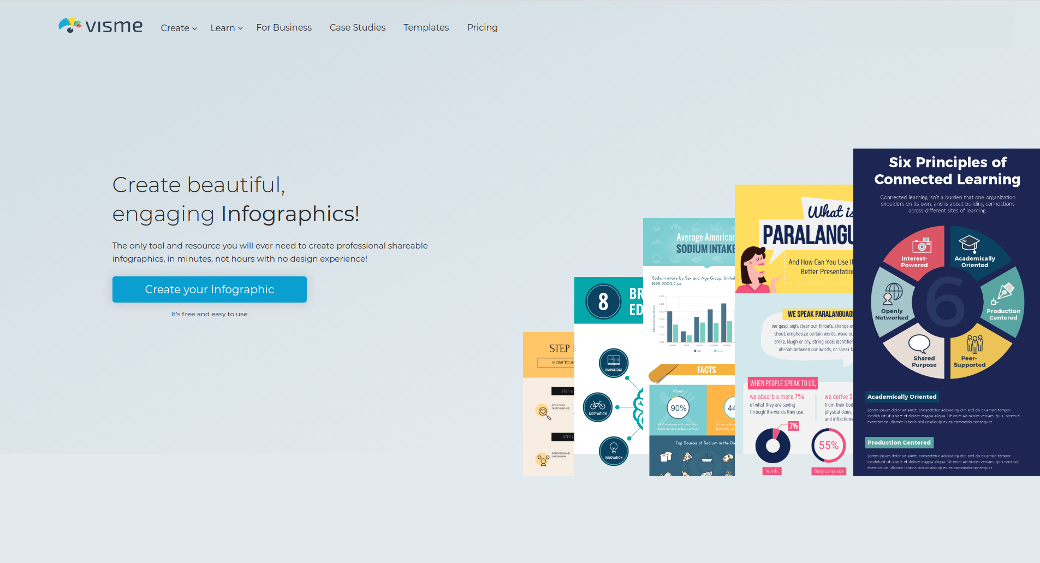
Visme Infographic Maker Tool
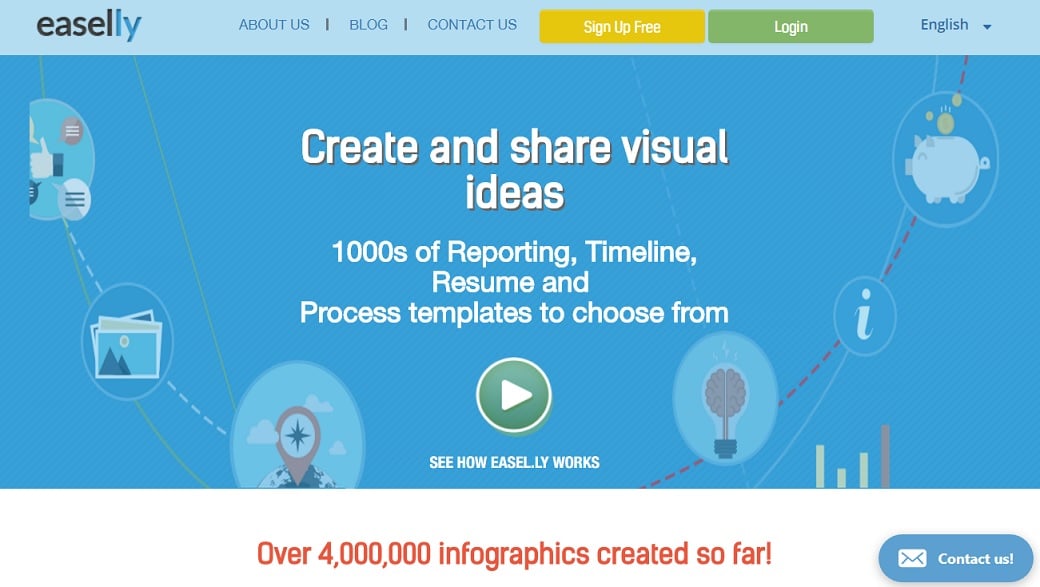
Easel.ly Infographic Maker
Easel.ly offers you various excellent infographic templates and hundreds of images for creating cool infographics. Moreover, you can upload your photo to make your background unique. What’s more, Easel.ly is free.
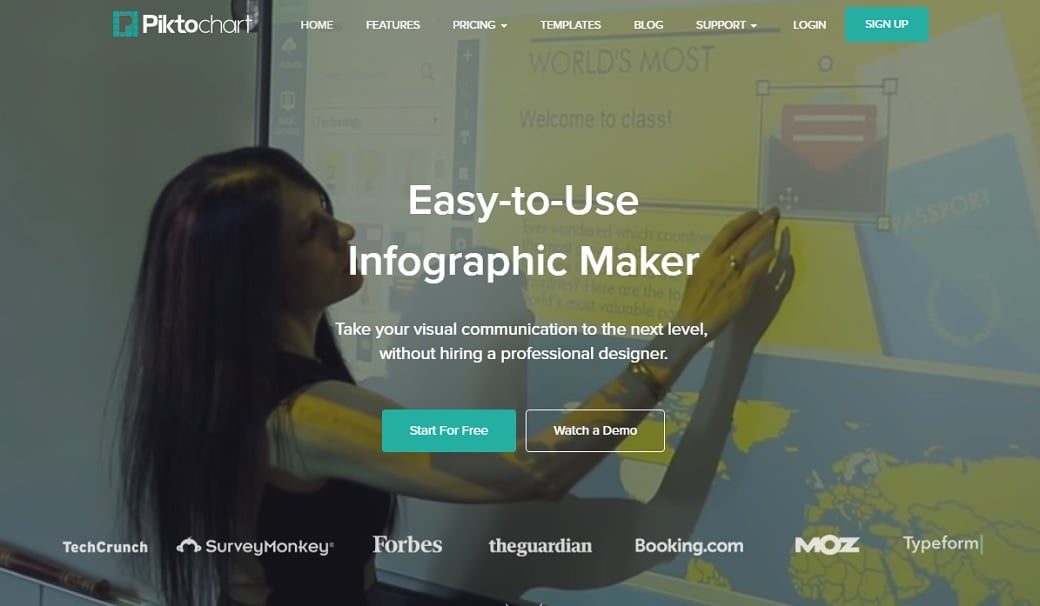
 Piktochart
Piktochart is a bit more in-depth than Easel.ly. The infographic maker not only enables you to customize different design elements but also add your own. It also allows you to embed videos to enliven your infographics.
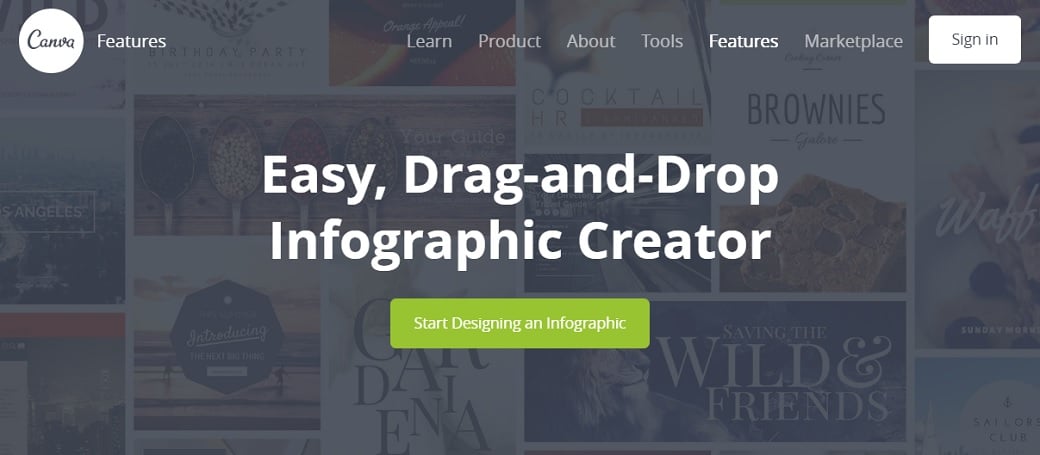
Canva
Canva, with its intuitive and clean layout, might be one of the most user-friendly infographic creators. It possesses a great library of images, fonts, icons, charts, graphs, and illustrations. Furthermore, the Canva community platform is where you can share your cool infographics with others.
Whatever infographic maker you choose, the basic process of your infographic creation will look like this.
Step 1: Clearly Define the Idea
No matter whether you’re comparing the best messenger apps or proving the existence of a UFO, your first step will be the same. If you want to create a worthy infographic, you should clearly see the idea you want to convey.
Great infographics aren’t just images with some text put together. It’s not enough to find separate facts and pictures on the topic. All of them should be united under the main thought you’re trying to express. Put, your infographic must tell a story with a coherent plot. It should grab the attention of your audience from the very beginning and not let them go until the end.
Useful hints
- Identify the style of your infographic story. Of course, the primary aim of any infographic is to educate and inspire your audience. Nevertheless, you can achieve the desired result in quite different ways. Ask yourself if you want your infographic to be surprising, funny, or severe.
- Make your story emotional. Avoid using dry numbers without context. Great stories should evoke emotions. Even negative emotions are better than indifference.
- Make sure the data is relevant. First, ensure that all the data you’re going to use is relevant to your message. More is not better, in our case. The access information will prevent your audience from staying focused on the main idea.
- Use trustworthy information. Compile the information only from reliable resources. Otherwise, your infographic may be inaccurate and disappoint your audience.
Step 2: Choose the Right Infographic Type
It’s no secret that even the coolest infographic can fail if its author chooses the wrong method of data visualization.

Imagine someone trying to show a step-by-step process of baking a delicious pie. However, instead of using a how-to infographic, he represents his story via charts. Maybe it’s his view of the world, and he does this to highlight the originality of his thinking. Yet, hardly any people will enjoy such an unusual presentation. They will find another description of the same recipe.

So, if you want your infographic to resonate and find its audience, think twice before selecting an infographic type.
Useful hint:
- Study some theories. If you are a beginner in infographics, it may not be a good idea to rely on your intuition fully. Spend some time studying the basics.
Step 3: Select a Suitable Infographic Template & Infographic Maker
Every infographic maker provides users a wide range of ready-made, customizable infographic templates. As usual, they are divided into categories to simplify the selection process. The main trick here is to avoid getting lost in the variety and choose the proper one.
The best infographic template for a novice should meet at least two main requirements. Firstly, it should enable you to fully convey the main idea of your infographic story to your audience. Secondly, as you are a beginner, there should be as few elements that require customization as possible.
Useful hints:
- Make sure that the template perfectly fits your story. You must admit that an infographic concerning serious health problems will look ridiculous on the template with a too-sunny background.
- Decide on the data layout. Think of the final destination of your infographic. The vertical format is better for web publishing because it allows for easy scrolling down, while the horizontal orientation is more convenient for slideshow presentations or print publications.
Step 4: Insert and Customize the Data
Hooray! The preparation stage is over at last. You are ready to put your data into the chosen infographic template. However, don’t relax. You’ve just come to one of the most important stages of the infographic creation process.
Scarcely any infographic maker can offer you a template that will completely suit your infographic without any customization. Therefore, the question of correct infographic design arises. Your design solution can either make your infographic cool or simply kill it.
Useful hints:
- Minimize the amount of the text. Too much text doesn’t fit the format of infographics. Short, clear sentences are your best bet.
- Present the data in an organized and sensible way. Arrange your data in a way that is easy to grasp. Make sure there are clear visual connections between various sections of your infographic. Use arrows to help the information flow smoothly.
- Don’t overdo the length. Keep the length of your infographic under 5000 pixels if you don’t want to lose the audience’s attention.
- Stick to one color scheme. Never forget that each element of your infographic should follow the same color scheme that includes just a few colors and shades. If you don’t know what colors to choose, look through this Color Combination Guide.
- Limit the number of fonts. Try not to use more than one or two fonts. If you don’t know which fonts to pair, use the classic combination of serif for the headline and sans serif for the body.
Step 5: Share Your Infographic
You want your infographic to be seen by as many people as possible. So, giving your infographic a little push is a good idea. To begin with, post it on your website. Then, place it on your social media pages. Finally, publish it on infographic-sharing platforms such as Visual.ly or Canvas Social Stream.
Useful hints:
- Include an embed code. The embed code at the bottom of your infographic encourages your audience to share it with others.
- Add sharing buttons. As a rule, an infographic maker offers you a set of social media sharing buttons. Don’t miss this chance!
Infographic Maker Tools – Summing It Up
To cut a long story short, it’s possible nowadays to create cool infographics without a designer. Just choose an infographic maker, follow the abovementioned steps, and use our hints. I hope you will enjoy the result!


Thanks for informative & detailed post on Info-graphics Post.
These tools are very important for SEO for help in designing easy & attractive make Info-graphics. These are some great tools to use when the time is of the essence! Thanks!! Info-graphics are being considered as the trendiest web content format in recent days. Quite surprisingly more then one & half billion items of brand new content are posted every day on different website including Videos, Tweets, Social Media Posts. Blogging & more.
Thank you for the comment!
We are doing our best to help our readers keep up to date and get new skills in design and web development. I hope this post will be helpful for those who are willing to have cool infographics on their website but don`t want to pay a small fortune of money for it.
Thank you for the comment!
We are doing our best to help our readers keep up to date and get new skills in design and web development. I hope this post will be helpful for those who are willing to have cool infographics on their website but don`t want to pay a small fortune of money for it.
We’ve done a few infographics at our law firm and ended up hiring someone on upwork. I did a bit of research on infographic makers but, my goodness, there were so many I wasn’t able to discern which ones would work for me. I wish I had seen this article a few months ago! I think you’ve invigorated me to give it another shot though. I think I’m gonna go with Canva and even do the $12 upgraded version, so cheap and I don’t want to get discouraged because I have a lack of features. Thanks Allison!
You are more than welcome, Virginia! Actually, we had the same pain some time ago. I had to create several inforgaphics and waiting for the designer response was like a nightmare. That`s why I decided to make a research and came up with several useful tools. Canva is the favorite one 🙂