How to Use Infographics in Your Marketing Campaign
Tired of writing blog posts 24/7 to no avail? There’s an old saying that insanity is doing the same thing repeatedly while expecting different results. Maybe it’s time for you to try a different kind of content, like infographics. In this post, we’ll look at the notion of infographics and find the reasons to apply infographics in marketing. Also, you’ll see some examples of convincing infographics.
So, what exactly is an infographic? An infographic is a visual representation of data or knowledge made to present complex data quickly and simply. In short, infographics are there to transform your boring blog posts into engaging visual content that the audience loves.
Why You Need to Use Infographics in Marketing
Let’s go through the reasons why infographics are important for you. After that, we’ll go on to look at the step-by-step process of how you can utilize infographics in marketing campaigns.
Human nature
The first and most important reason why you need to include infographics in marketing campaigns is the fact that infographics are mostly visual, and humans are naturally visual creatures. We understand information much better if images accompany it.

It’s scientifically proven by Howard Levie and Richard Lentz, who did a review of 55 experiments on the effects of illustrations on written texts. The research found that adding images to text can enhance learning ability up to a whopping 323%.
Visuals attract the audience better
As visual creatures, the audience is naturally more attracted to visual content than just mere articles. In fact, publishing a blog post with colorful images can attract 80% more readers. With infographics, the gap is so far that people are 30 times more likely to read an infographic than text-based content.
More likely to be viral
Visual content like infographics is easy to share almost anywhere you like, from your website, social media platforms, emails, and even on printed materials like brochures and posters.

Because it’s easy to share, people are more willing to do it. Indeed, infographics are the type of content that gets the most shares. According to Slideshare, people are 3 times more likely to share infographics on social networks than any other document. The more people share your infographic, the more likely it becomes viral.
Quick to digest
In today’s fast-paced universe, the audience’s attention span is getting shorter and shorter. In 2000, the average attention span was still 12 seconds. But today, you only have 8 seconds to hook in the audience to your content before they go away.
That’s why content that’s easy and quick to understand like infographics is the type of content that fits this generation better. As explained before, infographics are designed to convey complicated matters into a simple and easily digestible content.
People remember visuals better
For smaller businesses, it’s really essential to get the consumers to remember their brands. One of the best ways to do that is by using visual content like infographics. A study of the human brain showed that when given a piece of information, people will only remember 10% of it after 3 days. However, adding an image to the information will boost the number to 65%.
Gain more engagement on social networks
If you’re looking to enhance your social media marketing, it’s better to stick with visuals. Multiple studies have shown that visuals can boost your social media engagement:
- Tweets with pictures are 15 times more likely to be retweeted and gain 18% more clicks than text-only tweets.
- Facebook posts with images receive twice more engagement than posts without images.
- Posting visual content on LinkedIn attracts a 98% higher comment rate.
Different Kinds of Infographics in Marketing
After learning about the benefits of using infographics in marketing campaigns, let’s learn about the different kinds of infographics. In general, it is possible to divide infographics into two categories, which are statistical infographics and narrative infographics.
Statistical Infographics
Statistical infographics are the type of infographics that focus heavily on the presentation of data. Mostly, such infographics present the results of a survey, research, or study. Also, numbers and percentages are usually dominant in them. This type of infographics is well suited for the left-brained audience who mostly uses their logic and numerical ability. Here are a few examples of statistical infographics.
Data Visualization Infographic
Data visualization is used to present complex data into beautifully designed content. Use this infographic format to make boring facts and statistics more exciting and interesting to learn, as well as make the audience understands it better.
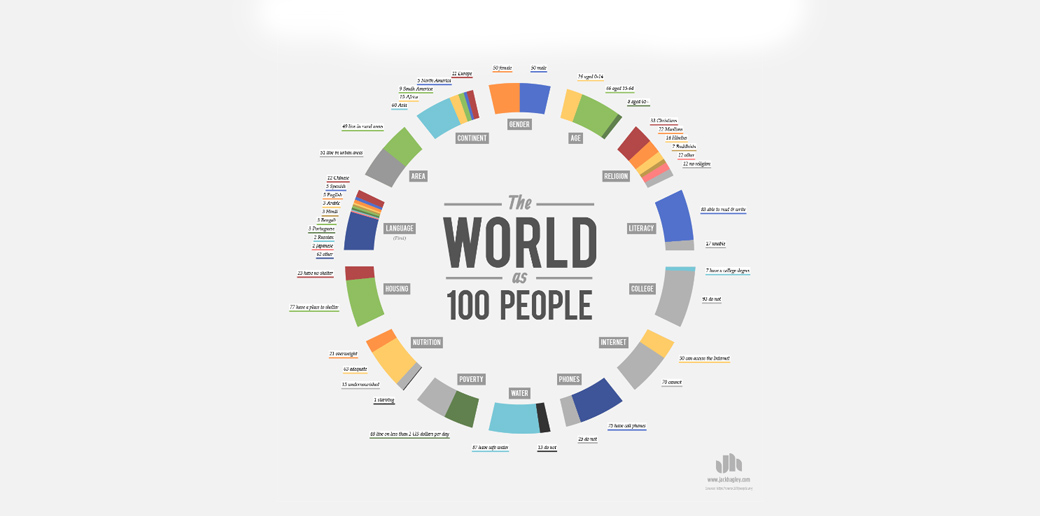
Geographical Infographic
A Geographical or map infographic is the perfect tool to present data statistics and trends based on location, be it between countries, cities, or regions.

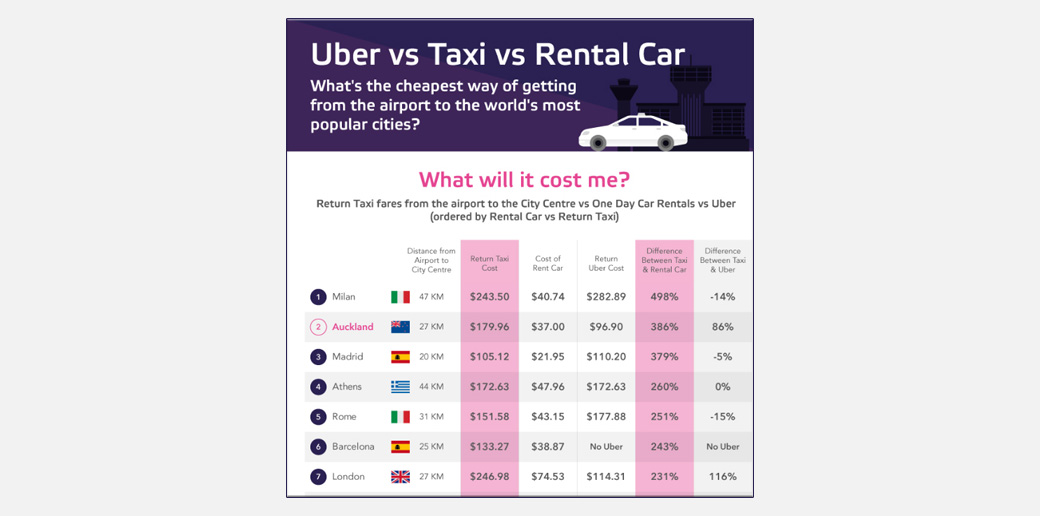
Comparison Infographic
A comparison infographic is a format used to compare two different things like ideas, places, famous persons, animals, etc. You can use this kind of content to show the differences between two similar things, similarities between two opposing things, or to prove which one is superior to the other.
Narrative Infographics
On the other hand, instead of presenting data statistics in numbers, narrative infographics turn them into engaging stories. This kind of infographics suits right-brained people who are more imaginative and creative. Take a look at the examples below to understand better.
Visualized Article
It’s quite clear from the name alone what kind of infographics this is. Basically, it’s just a much shorter version of your usual lengthy article, and with a lot more illustrations to make it more exciting and eye-catching.

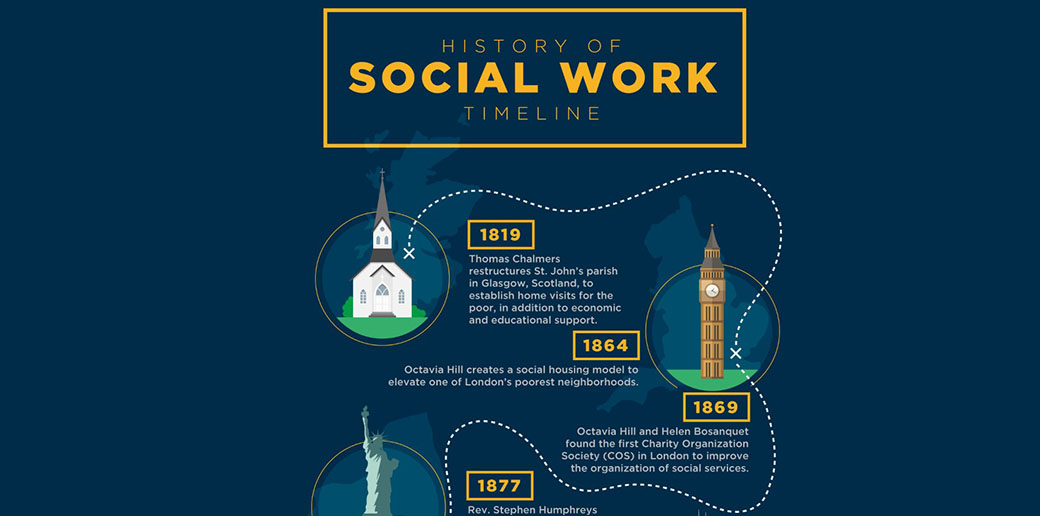
Timeline Infographic
A timeline infographic is usually used to tell a story about something in chronological order. This type of content takes the audience on a journey to discover events that took place in the past that they aren’t aware of before.
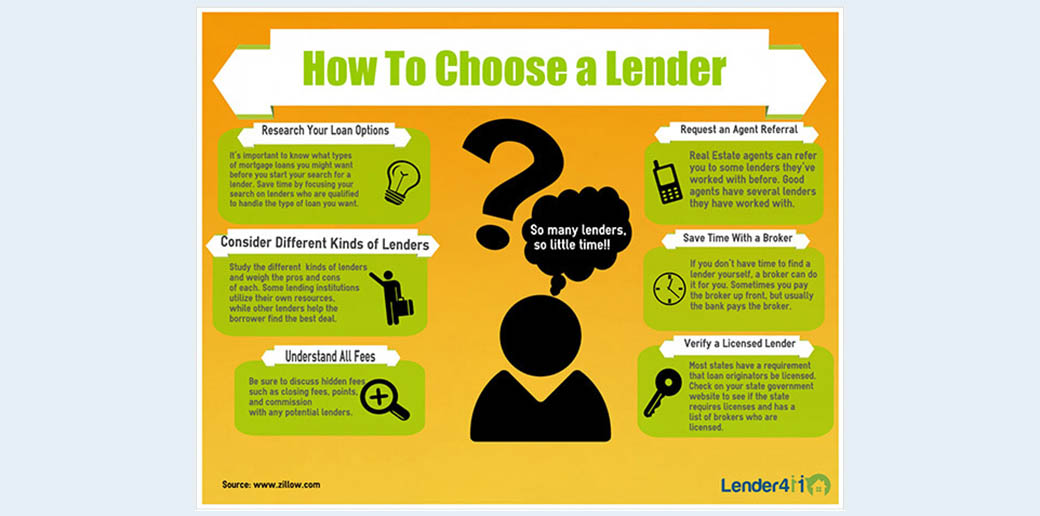
How-To Infographic
How-to infographics contain a guide to achieving a goal. Use this infographic format to explain and educate your audience on the step by step process of how to do something.
How to Implement Infographics in Marketing Campaign
Infographics are one of the best tools for link building ― a digital marketing strategy and actions whose aim is to gain more high-quality backlinks for your website. Increasing the number and the quality of your backlinks will make your website more relevant in the eyes of Google, making it rank higher on the search engine.
Here, we’ll go through the step by step process of gaining backlinks using infographics.
Step 1 – Post Infographics on Your Website
The first step is to publish the infographic on your website. Sometimes, when you’re able to produce a highly relevant and valuable infographic, heavy promoting isn’t necessary. People will automatically share it, creating a snowball effect that can even make it go viral. If it doesn’t, you can still promote it manually.
With website builders like Weblium, you can easily integrate your infographics into clean, mobile-friendly layouts without messing with code. This ensures your visual content looks sharp, loads quickly, and is shareable across devices—key factors for boosting engagement.
Step 2 – Use Infographic Directory to Implement Infographics in Marketing
The second step is to publish the infographic on infographic directory websites like Canva and Pinterest to boost your searchability. Here’s the complete list of infographic directories compiled by SEOblog.
Step 3 – Offer Infographics to Websites
The third step is to manually offer your infographic to other websites in a similar niche and industry― offering an infographic about pets to an automotive website wouldn’t work. Before you reach out, you have to manually search for suitable websites first.
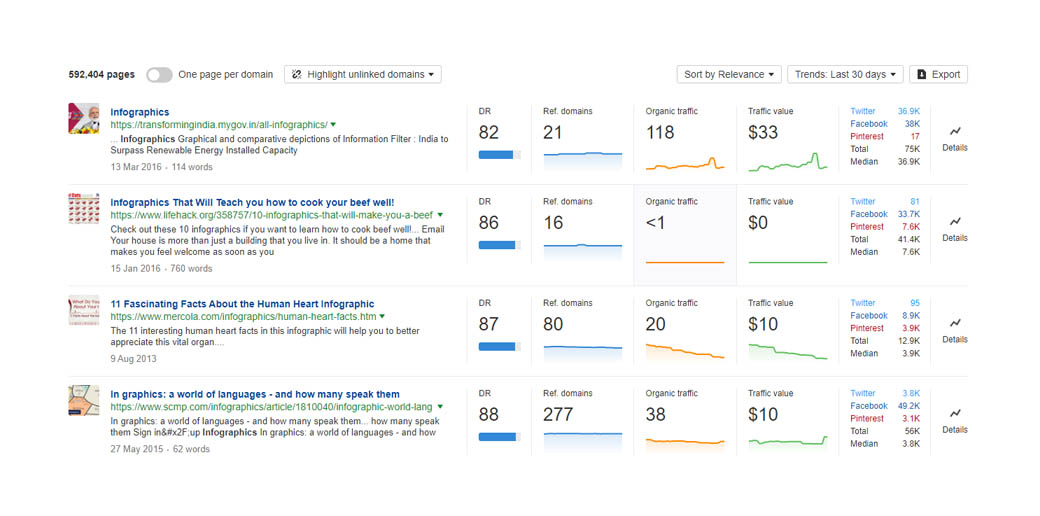
We recommend you to use Ahrefs because of its ability to collect massive amounts of websites in a very short time. It’s very simple to use, just go to “Content Explorer” and type in your target keyword. After that, Ahrefs will give you all websites across the internet that contains your keyword.
Step 4 – Search for Contacts to Implement Infographics in Marketing
After collecting potential websites, the next step is to compile the email addresses of those websites. This is the most time-consuming part of this whole process because you need to manually go to each of those websites and search for the contact person.
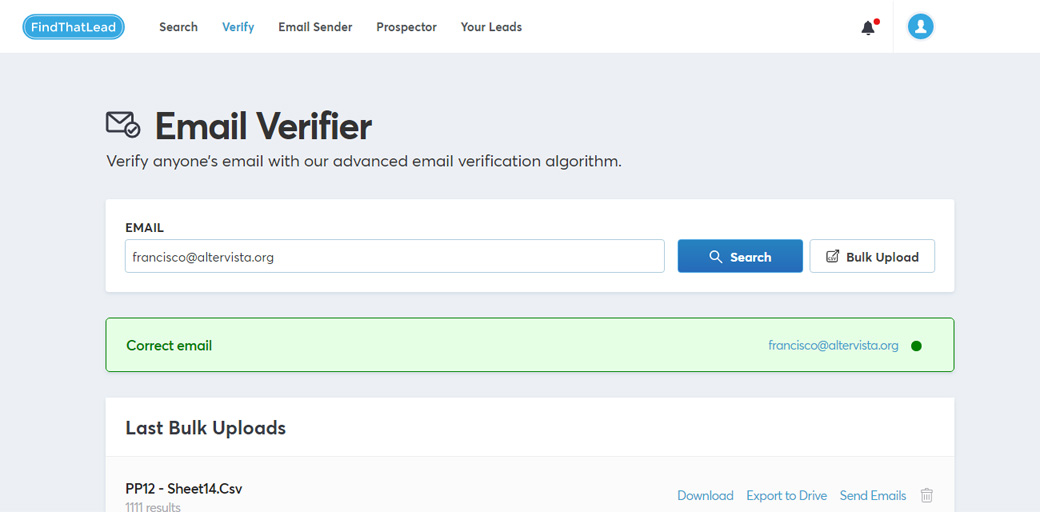
To shorten and ease up this process, use tools like FindThatLead. With this tool, you can search for email addresses more quickly and you can also verify the validity of an email address. When searching for email addresses, aim for people in positions like a writer, marketing, or content manager as they’re more likely to reply than higher positioned people like owner or director.
Step 5 – Send Emails with Infographics
After the email addresses are ready, it’s time to reach out to them. You can send the emails manually, which you can personalize more but obviously takes a longer time, or you can use tools like Mailmunch to send an email blast that reaches tons of addresses in a heartbeat.
What we usually do is to divide the addresses into two categories, which are websites with a Domain Rating (DR) higher than 70, and websites with a DR lower than 70. Then, we manually send more personalized emails to the addresses with a higher DR and send an email blast to the addresses with a lower DR.
Step 6 – Sharing Infographics in Marketing
After you’ve done sending the email outreach, wait for the reply. Your job is to nurture all the people that express interest in your infographic and get them to share the content on their website. It’s one thing to be interested in something, but it’s another thing to be willing to share it.
In our experience, you have to give them something valuable in return like a guest post. This way, you offer a win-win solution, where they get free content without creating anything and you get valuable backlinks.
With Weblium, you can create a dedicated “Media” or “Resources” section on your site to store all your infographics in one easy-to-share hub. This makes it simpler for journalists, bloggers, and collaborators to find and feature your visuals—helping your backlink strategy snowball faster.
Infographic Ideas
No matter how hard we try to make the perfect infographics, the truth is no infographic is ever made equal. Some will do better than others for one reason or another. That’s why it’s important to keep learning from other more successful infographics in marketing.
If you’re still not sure of what kind of content to create, take notes from these once viral infographics and implement it in your marketing strategy.
You VS John Paulson
Probably, you may never hear about it. However, this infographic was among the first-ever infographics in marketing that got viral. You VS John Paulson is an interactive infographic that was published back in 2011. Unlike the usual static infographics, this one requires your participation.
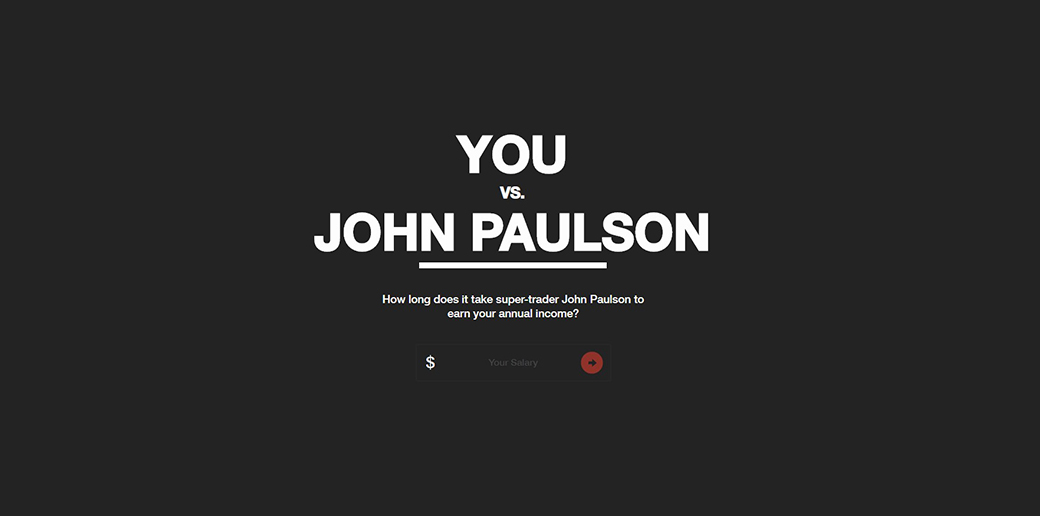
For this to work, you need to type in your annual income. Then, the page will reveal the comparison between your earnings and John Paulson’s, the rich American investor. This kind of infographic is great at boosting audience engagement.
The Best Career for Your Personality
No matter how harsh it might sound, the truth is there’s nothing people care more than themselves. However, you need to turn that trait to your advantage. One of the ways to do that is by creating content that focuses on the audience.
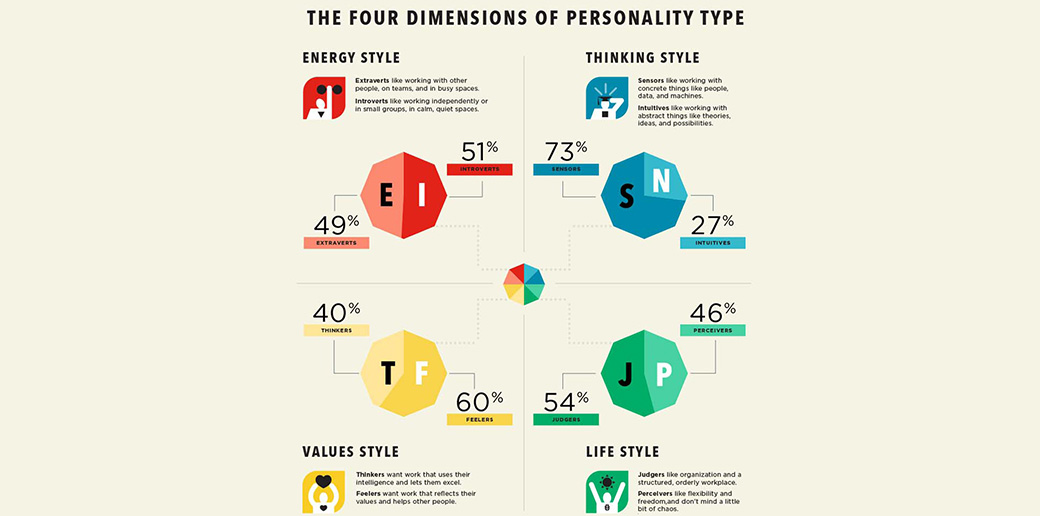
Just like this psychological infographic that was published by Truity entitled The Best Careers For Your Personality Type. By reading this infographic, the audience gets to know what type of person they are and what job suits their characteristics.
Invention Poll
Creating original content is one of the best hacks to get tons of shares and backlinks. Conduct your own polls, research, or study and then present your findings with an infographic. This way, people are going to link back to you as the original source when they use your data.
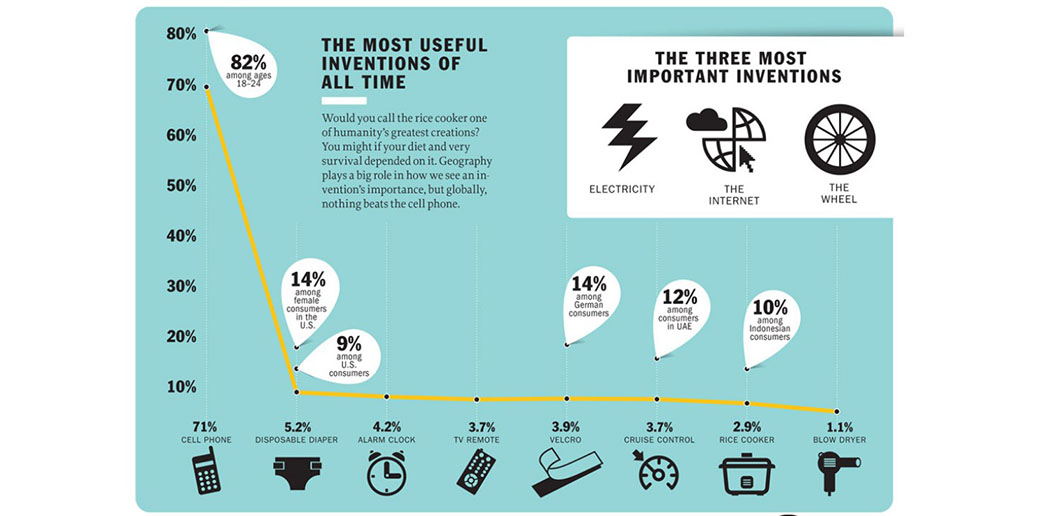
This is exactly what Time did in 2013 by creating The TIME Invention Poll. The content of this infographic is the results of a poll Time did with Qualcomm when they surveyed over 10,000 people in 7 mature and 10 emerging markets.
Using Infographics in Marketing – Takeaway
In a world full of articles, you need to create something a little bit different to stand out from the rest. Something like Infographics, one of the best marketing tools that suit this generation and time. Not only great at increasing your site traffic and attracting more backlinks, but infographics are also easy and affordable to make.
You don’t need to hire a professional infographic agency that’s out of your budget, you can make awesome infographics on your own using these amazing infographic making tools and platforms. Check out the link to discover over 100 tools in 9 categories that you need to create a proper infographic, including:
- Writing tools
- Data Statistics
- Visual Inspiration
- Content Research
- SEO Tools
- Stock Photos
- Icon Library
- Infographic Maker
- Chart Maker


Leave a Reply